MIAMI VALLEY REGION HOUSING DATA
In this section you will find the latest Dayton market updates, statistics, historical data, press releases, and other Dayton REALTORS® news. Check back often for the latest information.
A REALTOR® and the MLS is the premier source for accurate and up to date data for your market and community.
Local Government Officials
If you are a city or county official and wish to have a more in-depth report created for your city or county, you may contact us for a full report utilizing the REALTOR® Property Resource (RPR) data service. Please send all requests to Dan Douglas, Government Affairs Director, at ddouglas@daytonrealtors.org.
Elected Leaders
If you are an elected official and would like information on demographics, economic talking points, and real estate data for your district, please contact Dan Douglas, Government Affairs Director, at ddouglas@daytonrealtors.org.
General Media Requests
All media requests can be sent to Bob Jones, Communications Director, at bjones@daytonrealtors.org or by calling 937-610-1434.
DAYTON REGION MONTHLY HOME SALES - May 2026
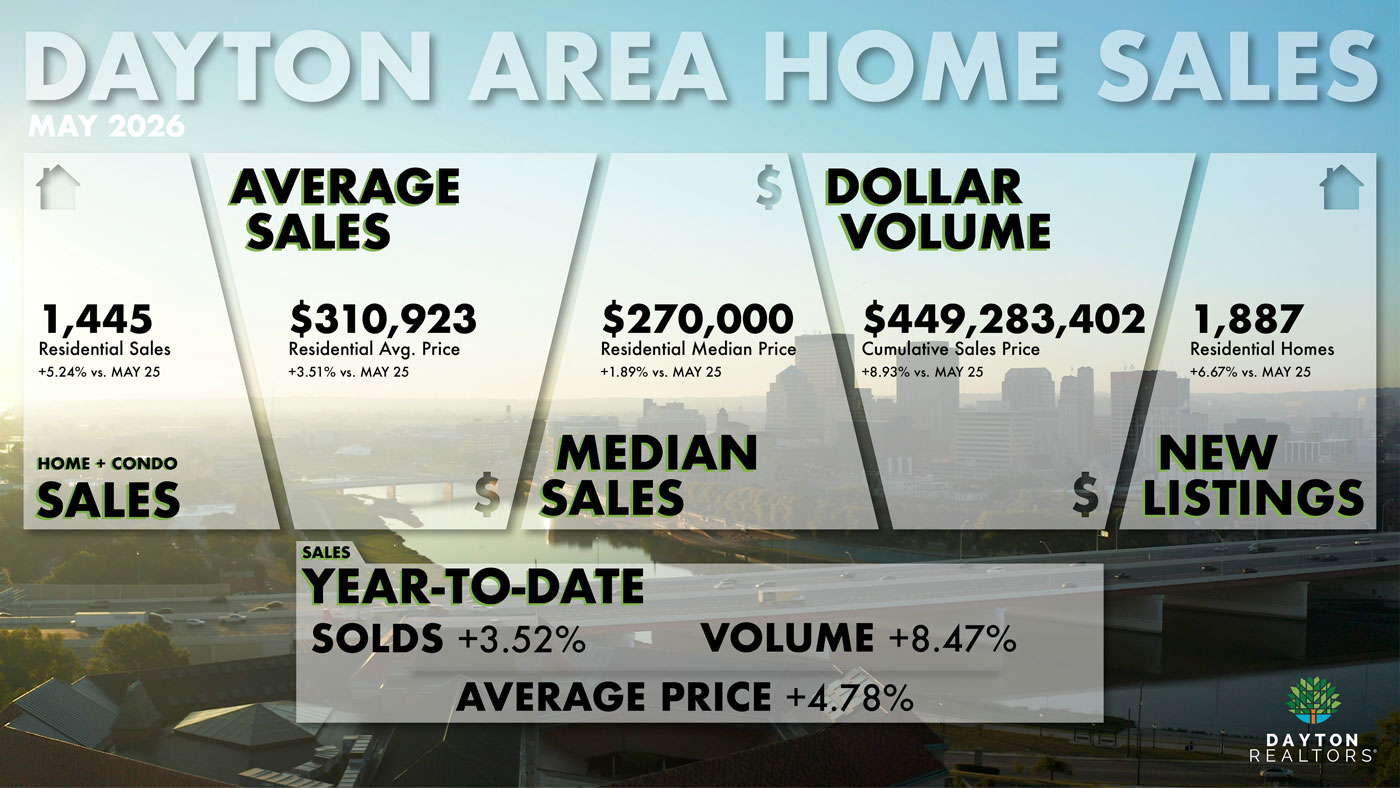
The Dayton REALTORS® Multiple Listing Service today reported positive numbers for the Miami Valley’s housing market in May, with single-family home and condominium sales demonstrating resilience and growth in all key areas. The monthly and year-to-date data indicate a stable market with appreciating property values.
For the month of May, the number of sales saw an increase of 5.24%, with 1,445 transactions compared to 1,373 in May of the previous year. As a result of this bump in sales volume, the total sales price for May reached an impressive $449,283,402, besting last May’s total volume by nearly 9%. The median sale price for May inched up by 1.89% to $270,000 from $265,000, and the average sales price similarly rose by 3.51% to $310,923, reinforcing the strong upward trend in home values. The sale-to-list price ratio remained steady at 100%.
Looking at the first five months of the year, year-to-date sales experienced an increase of 3.52%, with 5,614 transactions compared to 5,423 in the same period of 2025. This resulted in a 8.47% rise in total sales price, reaching $1,662,578,759 so far in 2026, up from $1,532,734,254 in 2025. Both median and average sale prices continued to climb, with the year-to-date median sale price increased significantly by 6.12% to $260,000, while the average sales price rose by 4.78% to $296,149.
New listings added in May totaled 1,887, showing an increase of 6.67% from 1,769 last year. Year-to-date listings tallied 7,588, a growth of 6.72% from 7,110 in 2025, indicating a relatively stable influx of new properties into the market. The total number of single-family homes and condominiums available in the MLS at month’s end was 2,051, an increase from 1,900 in May 2025. This represented a 1.4 month supply rate based on the current pace of sales.
|
MAY 2026 - MLS SINGLE-FAMILY & CONDO SALES |
|||
|
2026 |
2025 |
% Change |
|
|
New Listings |
1887 |
1769 |
6.67% |
|
Solds |
1445 |
1373 |
5.24% |
|
Total Sale Price |
$449,283,402 |
$412,432,741 |
8.93% |
|
% Sale/List Price |
100 |
100 |
0.00% |
|
Median Sale Price |
$270,000 |
$265,000 |
1.89% |
|
Average Sales Price |
$310,923 |
$300,388 |
3.51% |
|
YTD JAN-MAY 2026 - MLS SINGLE-FAMILY & CONDO SALES |
|||
|
2026 |
2025 |
% Change |
|
|
New Listings |
7588 |
7110 |
6.72% |
|
Solds |
5614 |
5423 |
3.52% |
|
Total Sale Price |
$1,662,578,759 |
$1,532,734,254 |
8.47% |
|
% Sale/List Price |
99.5 |
100 |
-0.50% |
|
Median Sale Price |
$260,000 |
$245,000 |
6.12% |
|
Average Sales Price |
$296,149 |
$282,636 |
4.78% |
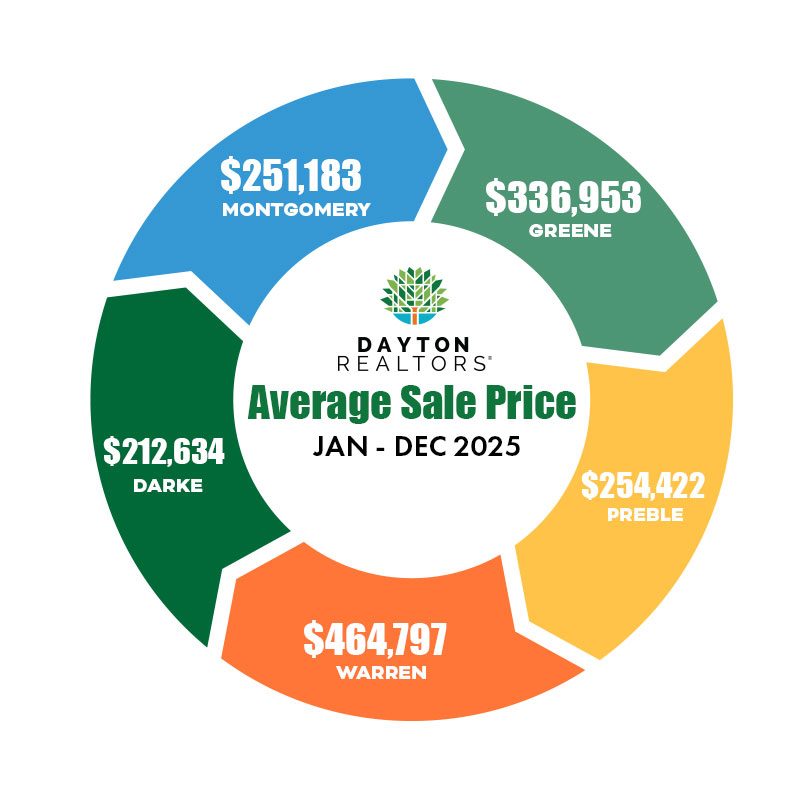
YEARLY SALES BY COMMUNITY - 2025
All statistics are derived from Dayton REALTORS® Multiple Listing Service and are believed to be accurate but not warranted. Please consult with your REALTOR® for more specific statistics.
| Community | Units Sold | Average Sale Price | Median Sale Price |
| Beavercreek/Bvrcrk T.S. | 806 | $390,279 | $345,000 |
| Bellbrook/Sugarcreek | 224 | $455,612 | $382,301 |
| Brookville | 107 | $303,076 | $299,990 |
| Centerville/Wash. T.S. | 954 | $381,441 | $337,950 |
| Dayton | 1498 | $141,565 | $135,000 |
| Eaton | 174 | $238,841 | $216,500 |
| Englewood/Clayton | 493 | $258,341 | $249,000 |
| Fairborn/Bath T.S. | 493 | $250,083 | $237,000 |
| Franklin/Carlisle | 358 | $286,896 | $272,631 |
| Greenville | 266 | $206,596 | $189,950 |
| Huber Heights | 585 | $237,883 | $222,500 |
| Jamestown/Cedarville | 110 | $305,234 | $275,000 |
| Kettering | 796 | $263,658 | $245,000 |
| Miamisburg/Miami Twp | 491 | $298,993 | $280,000 |
| New Lebanon | 74 | $226,972 | $197,500 |
| Oakwood | 150 | $443,159 | $382,500 |
| Springboro/Clearcreek T.S. | 572 | $552,534 | $475,000 |
| Trotwood | 170 | $176,771 | $175,000 |
| Vandalia | 311 | $304,169 | $270,000 |
| Waynesville | 104 | $552,259 | $465,000 |
| W. Carrollton | 365 | $206,236 | $202,500 |
| Xenia | 469 | $262,787 | $235,000 |
| Yellow Springs | 77 | $419,187 | $405,000 |