MIAMI VALLEY REGION HOUSING DATA
In this section you will find the latest Dayton market updates, statistics, historical data, press releases, and other Dayton REALTORS® news. Check back often for the latest information.
A REALTOR® and the MLS is the premier source for accurate and up to date data for your market and community.
Local Government Officials
If you are a city or county official and wish to have a more in-depth report created for your city or county, you may contact us for a full report utilizing the REALTOR® Property Resource (RPR) data service. Please send all requests to Dan Douglas, Government Affairs Director, at ddouglas@daytonrealtors.org.
Elected Leaders
If you are an elected official and would like information on demographics, economic talking points, and real estate data for your district, please contact Dan Douglas, Government Affairs Director, at ddouglas@daytonrealtors.org.
General Media Requests
All media requests can be sent to Bob Jones, Communications Director, at bjones@daytonrealtors.org or by calling 937-610-1434.
DAYTON REGION MONTHLY HOME SALES - APRIL 2025
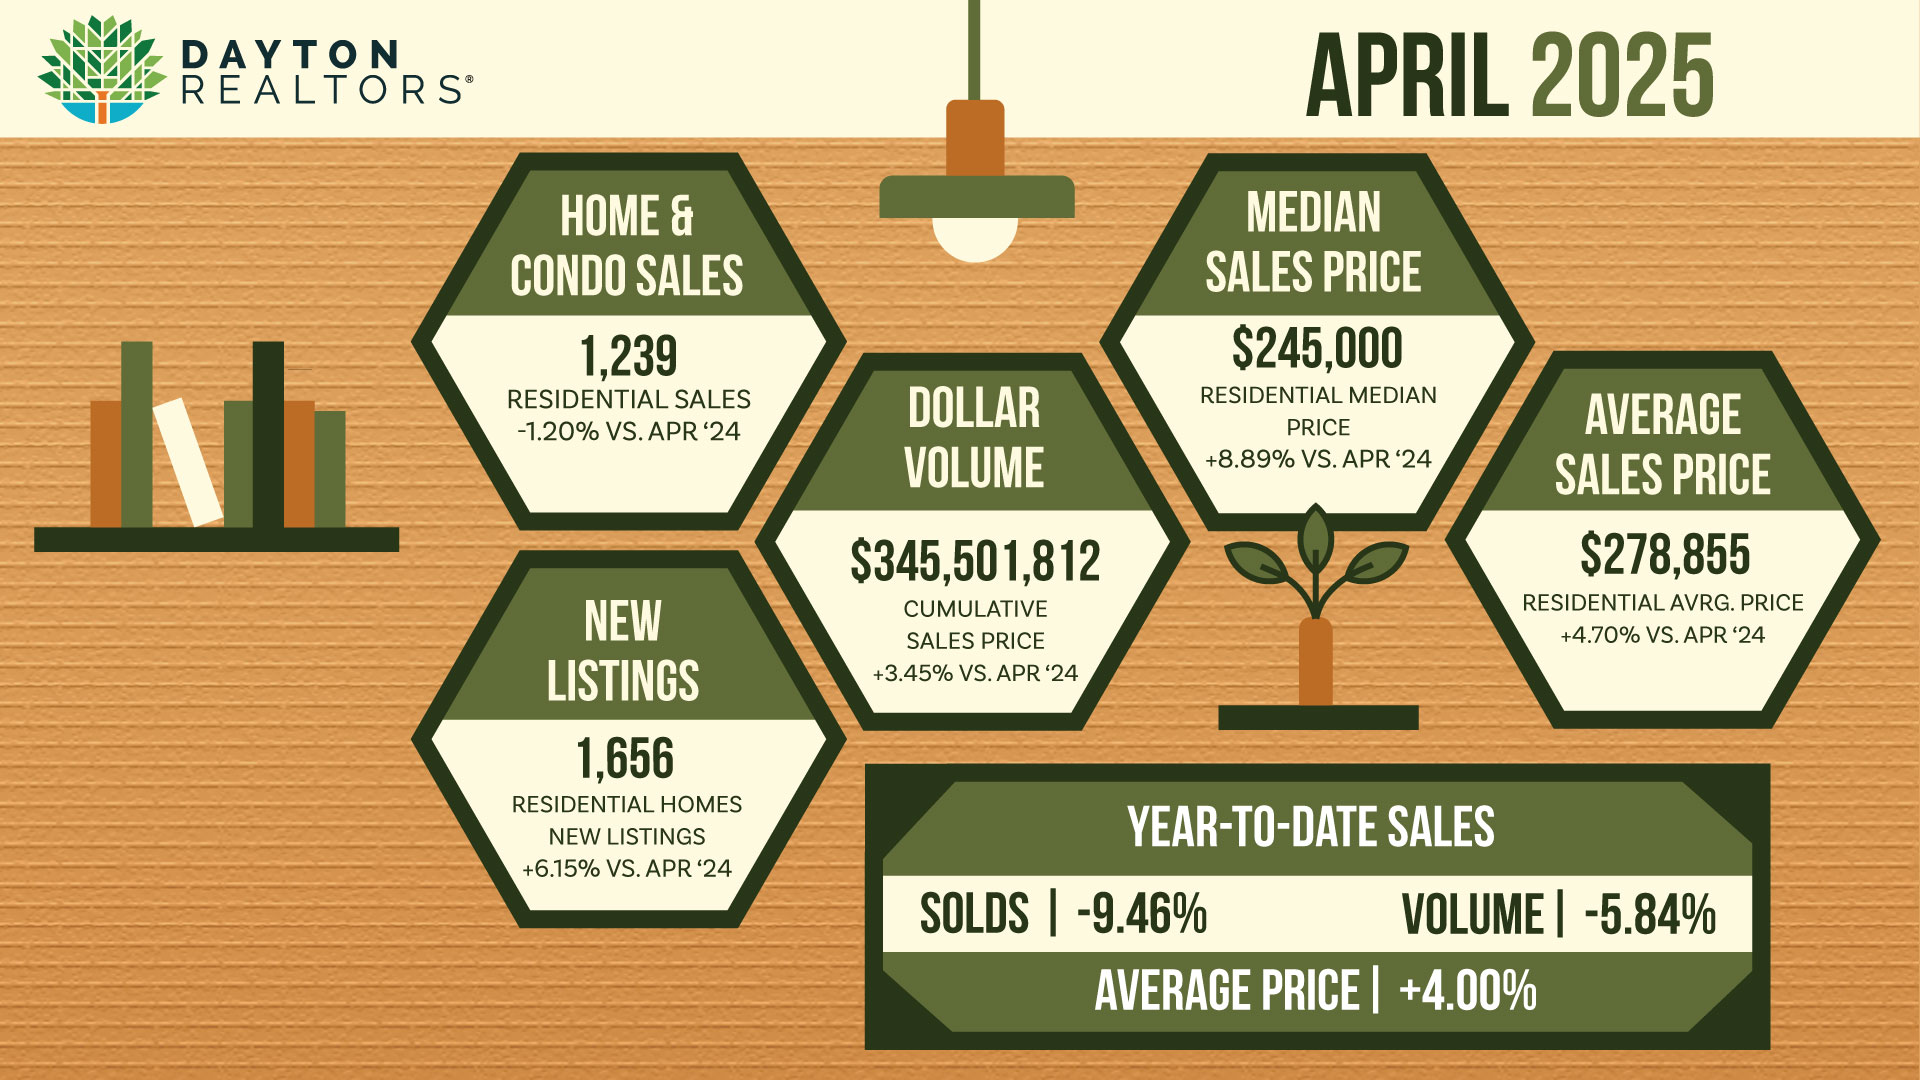
The Dayton REALTORS® Multiple Listing Service today reported a positive April for the Miami Valley’s housing market, with single-family home and condominium sales showing sustained growth in both volume and price. The monthly data indicates a resilient market trending upward.
The number of sales for the month experienced a marginal decrease of 1.20%, with 1,239 transactions in April versus 1,254 the previous year. Despite this slight dip in sales volume, the total sales price reached $345,501,812, marking a positive 3.45% increase over April 2024’s $333,991,414. This growth in dollar volume, even with slightly fewer transactions, highlights the appreciation in property values. The median sale price for April surged by almost 9% to $245,000 from $225,000, and the average sales price similarly rose by 4.70% to $278,855, underscoring the strong upward trend in home values.
The first four months of the year showed adjustments compared to the previous year. Year-to-date sales experienced a decrease of 9.46%, with 4,010 transactions compared to 4,429 in the same period of 2024. This resulted in a 5.84% reduction in total sales price, reaching $1,115,566,189 so far in 2025, down from $1,184,767,611 in 2024. Despite these declines in volume, both median and average sale prices continued to climb, reinforcing the strength of property values. The year-to-date median sale price increased by 6.40% to $239,400, while the average sales price rose by 4% to $278,196.
There were 1,656 new listings added in April, up 6% from last year, while year-to-date listings tallied 5,338, relatively flat from last year’s year-to-date figures.
The overall number of single-family homes and condominiums available in the MLS stood at 1,677 at month’s end, which represented a supply of 1.3 months, based on April’s pace of sales.
|
APRIL 2025 - MLS SINGLE-FAMILY & CONDO SALES |
|||
|
2025 |
2024 |
% Change |
|
|
Listings |
1656 |
1560 |
6.15% |
|
Solds |
1239 |
1254 |
-1.20% |
|
Total Sale Price |
$345,501,812 |
$333,991,414 |
3.45% |
|
% Sale/List Price |
100 |
100 |
0.00% |
|
Median Sale Price |
$245,000 |
$225,000 |
8.89% |
|
Average Sales Price |
$278,855 |
$266,341 |
4.70% |
|
YTD JAN-APR 2025 - MLS SINGLE-FAMILY & CONDO SALES |
|||
|
2025 |
2024 |
% Change |
|
|
Listings |
5338 |
5333 |
0.09% |
|
Solds |
4010 |
4429 |
-9.46% |
|
Total Sale Price |
$1,115,566,189 |
$1,184,767,611 |
-5.84% |
|
% Sale/List Price |
99.4 |
100 |
-0.60% |
|
Median Sale Price |
$239,400 |
$225,000 |
6.40% |
|
Average Sales Price |
$278,196 |
$267,502 |
4.00% |
YEARLY SALES BY COMMUNITY - 2024
All statistics are derived from Dayton REALTORS® Multiple Listing Service and are believed to be accurate but not warranted. Please consult with your REALTOR® for more specific statistics.
| Community | Units Sold | Average Sale Price | Median Sale Price |
|
Beavercreek/Bvrcrk T.S. |
724 |
$358,794 |
$333,250 |
|
Bellbrook/Sugarcreek |
297 |
$447,277 |
$406,500 |
|
Brookville |
119 |
$288,187 |
$299,900 |
|
Centerville/Wash. T.S. |
918 |
$355,478 |
$331,962 |
|
Dayton |
1607 |
$128,543 |
$122,000 |
|
Eaton |
141 |
$237,921 |
$220,000 |
|
Englewood/Clayton |
508 |
$245,360 |
$236,500 |
|
Fairborn/Bath T.S. |
505 |
$241,263 |
$210,000 |
|
Franklin/Carlisle |
314 |
$260,494 |
$250,750 |
|
Greenville |
221 |
$218,921 |
$182,000 |
|
Huber Heights |
573 |
$226,732 |
$212,500 |
|
Jamestown/Cedarville |
110 |
$263,850 |
$250,000 |
|
Kettering |
761 |
$248,528 |
$229,500 |
|
Miamisburg/Miami Twp |
477 |
$275,919 |
$265,000 |
|
New Lebanon |
70 |
$215,464 |
$185,000 |
|
Oakwood |
183 |
$459,640 |
$400,000 |
|
Springboro/Clearcreek T.S. |
484 |
$513,470 |
$434,325 |
|
Trotwood |
201 |
$163,830 |
$155,200 |
|
Vandalia |
301 |
$285,254 |
$259,900 |
|
Waynesville |
86 |
$471,885 |
$380,000 |
|
W. Carrollton |
361 |
$189,190 |
$189,000 |
|
Xenia |
466 |
$254,628 |
$224,950 |
|
Yellow Springs |
68 |
$430,595 |
$400,000 |